
- This event has passed.
Hands-on Data Analysis: IntelliPy
June 21, 2021 @ 8:00 am – 5:00 pm
Python GUI for analyzing IntelliCage data
Motivation
The IntelliCage system helps researchers to conduct behavioral experiments and learning experiments with mice while ensuring minimal human intervention. The animals can be observed for long time periods – up to several weeks. This long-term data acquisition can provide new insights in mouse behavior, that might not be detectable in short-term observations. However, analyzing those big amounts of data is challenging for many researchers.
IntelliPy aims to simplify and automize many aspects of the analysis, such as acquiring data per group, creating learning curves or pivoting parameters in different timeframes. All plots are automatically created and the final tables for statistical tests are stored separately for the user.
Outline
In this Hands-On Tutorial, I will try to get you familiar with the Installation, Usage and the benefits of the IntelliPy GUI.
Requirements
No deeper knowledge about programming is necessary, as IntelliPy is aimed to be useable by scientists with little or no programming / data science experience.
Details
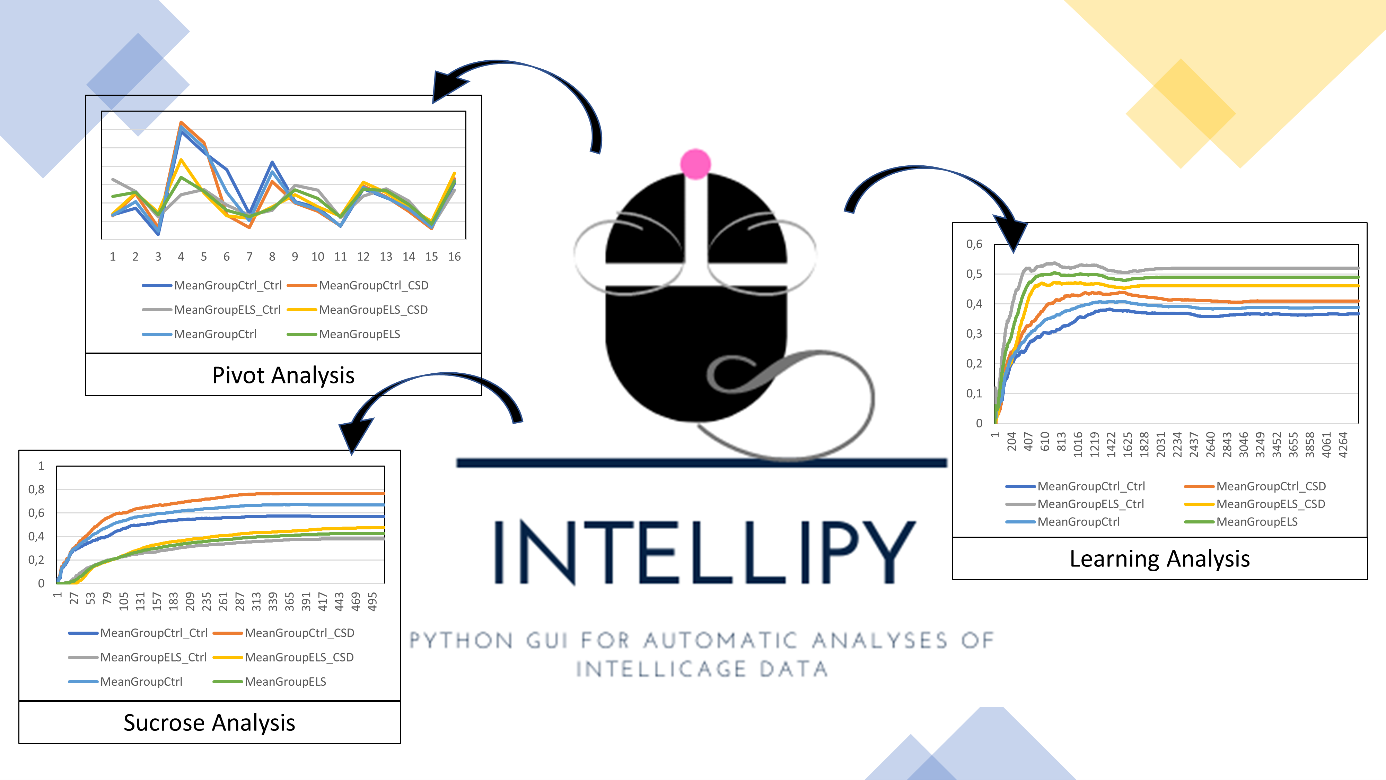
IntelliPy is capable of doing three kind of analyses:
- Pivot Analyses
- Learning Analyses
- Sucrose Analyses
Pivot Analyses:
For the parameters, measured by the IntelliCage Systems, such as Lick Duration, Nosepoke Number or NosepokeDuration, pivot tables are created for each module by IntelliPy. By default, these timeframes are created per day, but the user can add more timeframes using the IntelliPy GUI, like e.g. 12-hour or 6-hour timeframes. For further sttistical analyses, the pivoting results are stored as CSV files.
Learning Analyses:
As the experiments conducted with the IntelliCage systems can be conducted as learning experiments with different setups per phase, the learning rate of each individual as well as for the each group can be of high interest. Rather than only the final rate of correct attempts, the rate per hour and per visit is computed and plotted by IntelliPy. This enables the user, to utilize longitudinal learning information for each individual and group. For those learning rates, it is even possible to include all nosepokes or to remove those that were not followed by a lick. It can be argued about, whether a nosepoe without a lick should or shouldn’t be accounted as a correct attempt, so this decision is up to the user. Furthermoe, there are both, the possibility to exclude all nosepokes not followed by a lick or to treat them as incorrect attempts.
Sucrose Analyses:
For learning experiments, including the choice between water and sucrose, the proportion of LickDuration spent for Sucrose over time is computed by IntelliPy. Additionally, it is possible to define Sucrose and Water or just one of both as correct for the learning rate.
Correspondence:
For questions write to: Nicolas.ruffini@lir-mainz.de